Skip to content
Observability

LLM observability: traces, evaluations and OTLP export

LLM observability means seeing every model, tool and agent call as a trace you can read, evaluate and export. In Skyfix traces, metrics, evaluations and alerts come from the same request evidence the gateway records, and they leave your installation only to collectors you configure.

  • Request traces
  • OpenTelemetry export
  • Online evaluations
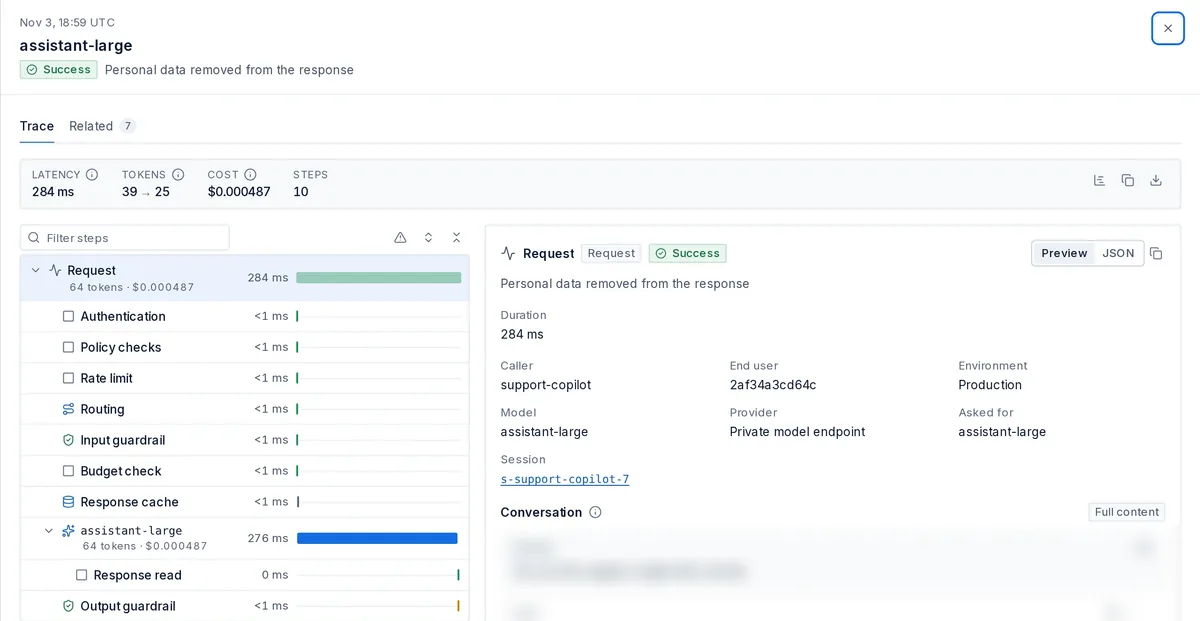
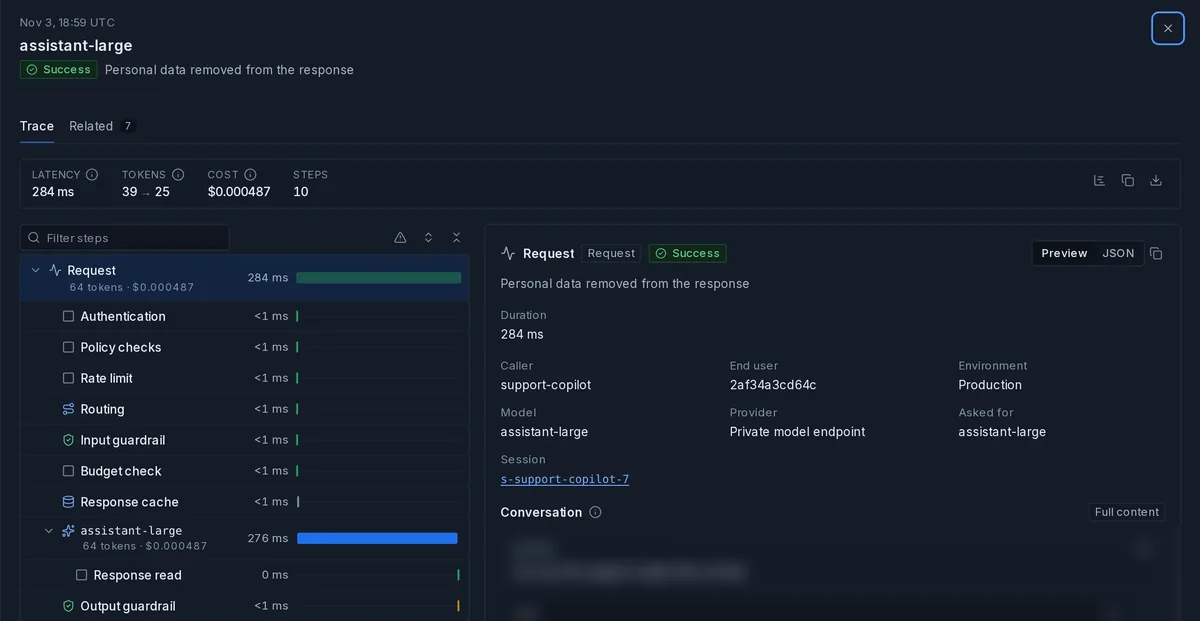
A request trace in the Skyfix console: a timing waterfall with authentication, policy checks, rate limit, routing, input guardrail, budget check, response cache, the model call and output guardrail, next to the request details (caller, end user, environment, model, provider and session) and a conversation panel whose content is hidden.A request trace in the Skyfix console: a timing waterfall with authentication, policy checks, rate limit, routing, input guardrail, budget check, response cache, the model call and output guardrail, next to the request details (caller, end user, environment, model, provider and session) and a conversation panel whose content is hidden.
One request, traced. One request traced through authentication, policy, routing, guardrails, budget and the model call.Illustrative synthetic data

One control plane

Where this sits in the request path

Traces and metrics are emitted from the same pipeline stage that writes the ledger, so what you observe is what was recorded.

  1. Identity

  2. Policy

  3. AI Firewall

  4. Budget

  5. Route

  6. Evidence

01

Request traces

Every request becomes an observation tree: authentication, policy checks, rate limit, routing, input guardrail, budget check, cache lookup, each provider attempt and the output guardrail, each with its own timing on a waterfall. The request detail shows the caller, end user, environment, model alias, the provider actually used, tokens, cost and the session it belongs to. Related requests group by trace, session or workflow, so an agent loop with a dozen tool calls reads as one story rather than a dozen rows.

Prompt and response content is hidden by default and shown only to roles with content permission, within the retention and redaction rules the workspace sets.

  • One waterfall per request, one row per stage and per provider attempt.
  • Caller, end user, environment, alias, provider, tokens, cost and session on the same screen.
  • Related requests grouped by trace, session or workflow.

02

Traffic and request views

  • Request types

Above the single trace sit the views operators use every day. The traffic view charts requests, error rate, latency, spend and AI Firewall blocks for the selected environment over the last 24 hours, against the prior period. The request log lists every governed request with its type (model call, MCP tool call or A2A task), outcome, guardrail result, latency, tokens and cost, filterable by any of them; each row opens its trace. Fleet and service status sit beside the traffic so an error-rate change can be read next to the gateway that produced it.

03

OpenTelemetry export

  • GenAI conventions
  • OTLP metrics

Traces export over OTLP per provider attempt and follow the OpenTelemetry GenAI semantic conventions, so they land in your existing tracing backend with the attributes it expects. Gateway and control-plane metrics are scraped the usual pull-based way and can also be pushed over OTLP as HTTP or gRPC, with counters as monotonic sums, gauges as gauges and histogram buckets as explicit bounds. Metrics push is off by default, the export interval is yours to set, and the installation CA is the only TLS anchor.

04

Online evaluations and experiments

  • Code evaluators
  • Experiments

Sampled live traffic can be scored with rules or judge models, and prompt or model variants can be compared in experiments over a saved dataset with versioned code evaluators. Judges and experiments run through the installation gateway, so they obey the same routing, budgets and data controls as production traffic, and experiment evidence is signed under the installation's evidence key. Comparison pairs results by item and evaluator and flags regressions.

  • Online rules and judge models score a sample of live traffic as it flows.
  • Experiments compare up to four variants over a saved dataset with pinned evaluator versions.
  • Results pair by item and evaluator, with a regression badge and signed, downloadable evidence.

05

Prompt capture and privacy

Observability must not become a second copy of your sensitive data. Content capture is a workspace setting with redaction, sampling and retention; prompts are hidden by default; viewing content needs a specific permission and is itself audited; and data controls are re-checked before any captured content is used by an evaluation or an experiment.

06

SIEM forwarding and alerts

  • RFC 5425

Security and audit events forward to your SIEM over syslog with TLS (RFC 5425) or HTTPS. Budget, approval and posture alerts share one routing configuration to chat, email or webhooks, so an alert about an exhausted budget and one about an open firewall case reach the same on-call channel.

07

Fleet health

Gateways heartbeat with signed reports that show readiness, version, AI Firewall version and configuration drift, and directives back to a gateway are signed too. Live traffic views show requests, error rate, latency and spend for the selected environment, and a drain control takes a gateway out of rotation without dropping in-flight requests.

FAQ

Questions this page answers

What is LLM observability?

Seeing each model, tool and agent request as a trace with its timing, policy outcome, route, cost and outcome, plus the metrics and evaluations built from those traces. Skyfix derives all of it from the same evidence the gateway records.

Which OpenTelemetry conventions are used?

The OpenTelemetry GenAI semantic conventions for traces, exported over OTLP per provider attempt. Metrics follow the gateway's documented metric contract and export over OTLP as HTTP or gRPC.

Is prompt content stored?

Only when a workspace enables content capture, with redaction, sampling and retention applied. Prompts are hidden by default and viewing them needs a content permission that is audited.

Can I send traces to my own collector?

Yes. Set an OTLP endpoint per organization and traces and, optionally, metrics go to it over TLS anchored on the installation CA. Nothing is exported until an endpoint is set.

How do online evaluations stay under policy?

Judge calls and experiment variants run through the installation gateway as governed requests, so routing, budgets, the AI Firewall and data controls apply to them exactly as to production traffic.